
Supposedly a leaked, internal-only Microsoft parody:
This, from Microsoft?
Er …

Supposedly a leaked, internal-only Microsoft parody:
This, from Microsoft?
Er …
From the Age (my emphasis added):
Vatican City: Pope Francis has denounced the global financial system, blasting the “cult of money” that he says is tyrannising the poor and turning humans into expendable consumer goods.
In his first major speech on the subject, Francis demanded Thursday that financial and political leaders reform the global financial system to make it more ethical and concerned for the common good. He said: “Money has to serve, not to rule!”
I suggest that, if ‘Frank’ is frank about his rhetoric, that he begin by carefully, prayerfully, and conscientiously reexamining ‘his’ church’s teaching, right back through its entire history, on the key question of Usury.
He might like to purchase Michael Hoffman’s “Usury In Christendom: The Mortal Sin that Was, and Now Is Not” to save him spending an eternity in research purgatory.
When ‘Frank’ humbly recognises that he, along with all his preceding “Infallible’s” since the Renaissance, are — by practice and decree of the church in its first millennia and a half — all flagrant heretics on the question of Usury, then this blogger might begin to take his preaching seriously.
In the meantime, I will continue pontificating my own “vision” for an alternative “money” system. One that would indeed “reform the global financial system to make it more ethical and concerned for the common good” –
The People’s NWO: Every Man His Own Central Banker
Go the biff!
From The Land (h/t Michael Anderson @irontracktor):

TENSIONS between Independent MP Tony Windsor and Queensland Nationals Senator Barnaby Joyce flared up in a robust exchange in the parliamentary press gallery in Canberra on Wednesday.
As politicians walked the press gallery discussing the previous night’s budget, Mr Windsor and Senator Joyce unexpectedly crossed paths, sparking a brief but fiery exchange.
Senator Joyce had earlier used parliamentary privilege to try and link the $4.625 million sale of Mr Windsor’s family farming property to Werris Creek Coal, a subsidiary of Whitehaven Coal, and corruption allegations against former NSW Labor Resources Minister Ian Macdonald.
Relations between the pair are already strained with Senator Joyce challenging for Mr Windsor’s New England seat at the upcoming federal election, in a bid to enter the Lower House.
Senator Joyce said he was “accosted” by an angry Mr Windsor who told him to “say it outside”.
Mr Windsor was referring to the comments Senator Joyce made in a three-minute speech in Senate debate on Tuesday on Mr Windsor’s Environment Protection and Biodiversity Conservation Amendment (EPBCA) Bill, which is linked to water protection measures for coal and coal seam gas (CSG) mining projects.
Senator Joyce said the Bill – which has already passed the Lower House – would be supported by the Coalition and Mr Windsor was one of its “grand architects”.
“Minister Macdonald was the minister in NSW when Mr Windsor sold his place for a very good price; for a very good price,” Senator Joyce said in the Senate debate.
Mr Macdonald is currently the subject of a high profile corruption investigation in NSW over allegedly corrupt mining deals.
“But it is a question we rightly want to ask: how do you manage to sell your place for such a good price?
“How do you manage to get three times what it is worth?
“I do not know. Do you know? How do you? It is such a great trick.”
…
Speaking to Fairfax Agricultural Media, Senator Joyce said his political foe was “highly sensitive about the sale of his land to a coal mining company which he made an extremely good price for, a bit less than $5000 an acre”.
“He’s so sensitive about it that he wants to accost me as I walk through the corridors of parliament house and he did it in front of people,” he said.
“Everyone can attest to it, I walked past Mr Windsor and in an agitated state, he asked if I would take something outside.
“At the start I thought he wanted to fight me, which I thought was a bit beyond his age.
“I think it’s fair enough Mr Windsor answers questions about this… it seems peculiar… he’s terribly sensitive about it.”
Read more here.
Let’s hear a caustic cheer for all the “experts” who insist that Australia’s public debt is “small”, and does not matter.
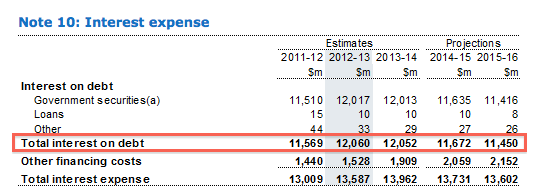
Interest on debt forecast, Budget 2012-13:
Interest on debt forecast, Budget 2013-14:
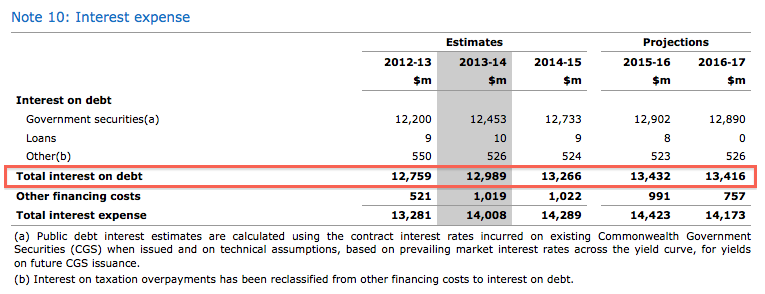
That’s a blowout of $699 million in 2012-13. $937 million in 2013-14. $1.594 billion in 2014-15. And $1.982 billion in 2015-16.
For a grand total blowout — just the blowout, not the total — of $5.2 billion “over the forward estimates.”
Now remember — all this is based on the forecast assumption of 5% per annum nominal GDP growth in the next two years. Even if that were to happen, the forecast is for another deficit (ie, more borrowing, at interest) of $18 billion in 2013-14, and $10.9 billion in 2014-15.
So, what do you think is going to happen to the forecast budget deficits — and the forecast interest on debt — if when that GDP forecast turns out to be highly optimistic … again?
Dear reader, I invite you to ponder, if you will, just how much productive investment could be made, if the economy were not loaded down with the ever-increasing burden of repaying a forecast $14 billion every year to (mostly foreign) bondholders, just for Interest on the Federal government’s debt?

Here is the excellent Leith van Onselen, chief economist at the equally excellent macrobusiness.com.au, giving the Treasury department’s panglossian view a most excellent poke in the eyes.
His affirming the substance of my slightly error-prone critique of last night only makes it the more enjoyable reading for your humble blogger (emphasis added):
To say that I am sceptical of the Budget forecasts is an understatement. Despite the Kouk’s bizarro reading, I see a number of potential problems with the Treasury’s forecasts, which appear to be based on unrealistic underlying assumptions and mis-reading of the stiff headwinds facing the economy.
First of all, consider the Treasury’s assumed growth in nominal GDP, which is forecast to expand from 3.25% in 2012-13 to 5.0% in both 2013-14 and 2014-15…
For the uninitiated, nominal GDP is the dollar value of what’s produced and earned across the economy. It’s also the measure that drives taxation revenue. Nominal GDP grew by just 2.0% in the year to December, far below real GDP growth of 3.1%, which is the quantity of goods and services produced. While the fall in nominal GDP below real GDP is unusual, having happened only a handful of times since the late-1950s, it has happened twice under the current Labor Government’s watch – during the GFC and currently – on both occasions driven by sharp falls in commodity prices (reducing the dollar value of Australia’s exports) and the terms-of-trade…
The terms of trade forecasts are very aggressive. they assume significant uplift for the March and June quarters for this year. An almost non-existent fall next year and 2% in 2014/15. These figures do not come terms with a China adjustment at all.
…
In light of the ongoing slump in the terms-of-trade, the Treasury’s nominal GDP forecasts appear highly optimistic. According to the Budget papers, a 1% change in the value of goods and services generates a $2.8 billion shift in the budget bottom line in the first year and a $7 billion shift in the second. Therefore, by assuming stronger growth in nominal GDP, the Treasury has likely overestimated Budget revenues and the path back to surplus.
…
The other area of concern with the Treasury’s outlook relates to the upcoming peak and then decline of mining capital expenditures (capex). Treasury remains of the view that mining capex will unwind in an orderly manner and that overall jobs growth will improve as the non-mining economy picks-up steam…
Given that around 10% of the Australian economy are employed in mining-related activities, mostly in areas unrelated to actual extraction (e.g. construction workers, engineers, and mining services), and that mining capex will soon go into an as yet ill-defined but likely sharp decline, Treasury’s steady-as-she-goes employment projections also appear overly optimistic.
Read the entire article here.
I am so glad that Wayne Swan is such an imbecile.
It means that, despite being sick, I can debunk his entire budget with about as much ease as taking candy from a baby.
Or a Baby Bonus from a “working family”.
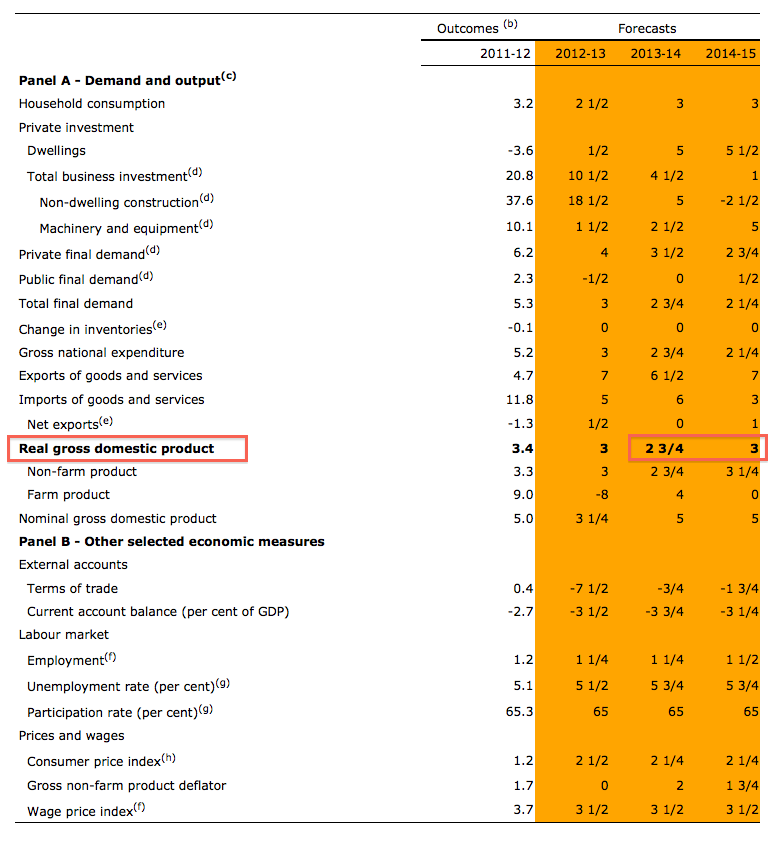
All of the “estimates” and “projections” in Wayne’s 2013-14 budget are based on a critical assumption – 5% annual growth in GDP in the next two years:
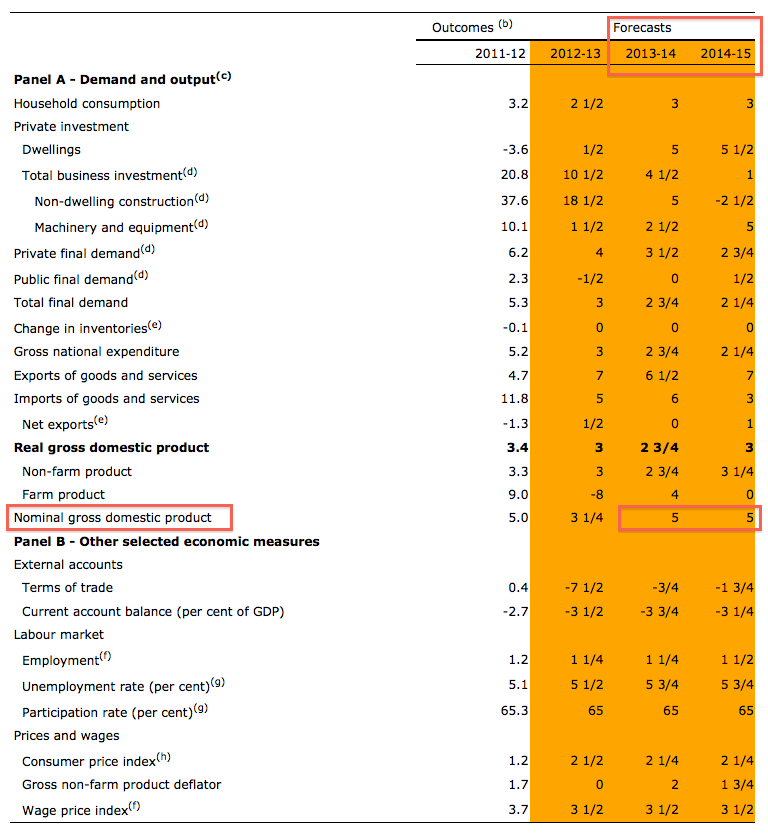
Budget 2013-14 Overview, Appendix H
Really Wayne?
5% a year?
Let’s see what the RBA’s Chart Pack has to say about actual, not “forecast” GDP –
Er…
Anyone else get a sense of deja vu about this?
With good reason. In last year’s budget, Wayne forecast 5% GDP growth for the current year…
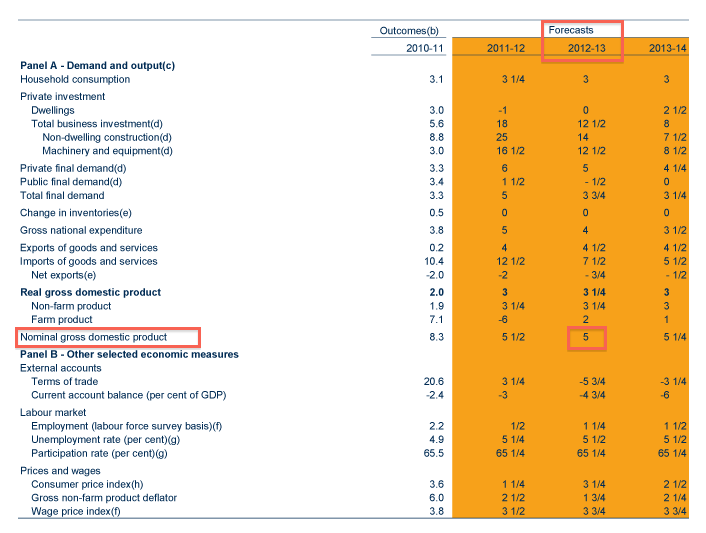
Budget 2012-13 Overview, Appendix H
… and since then, has been forced by that little thing called “REALITY” to revise it down, to 3.25% (see 1st chart).
Remember, this 35% downward revision for “GDP” growth in the current year has come during a period when, according to none other than Wayne himself, we have been enjoying the benefits of a “strong economy, low unemployment, low interest rates, and a huge (mining) investment pipeline.”
Not to mention record-high Terms of Trade.
That “huge” mining investment pipeline is rapidly closing down.
And the record-high Terms of Trade are collapsing too:
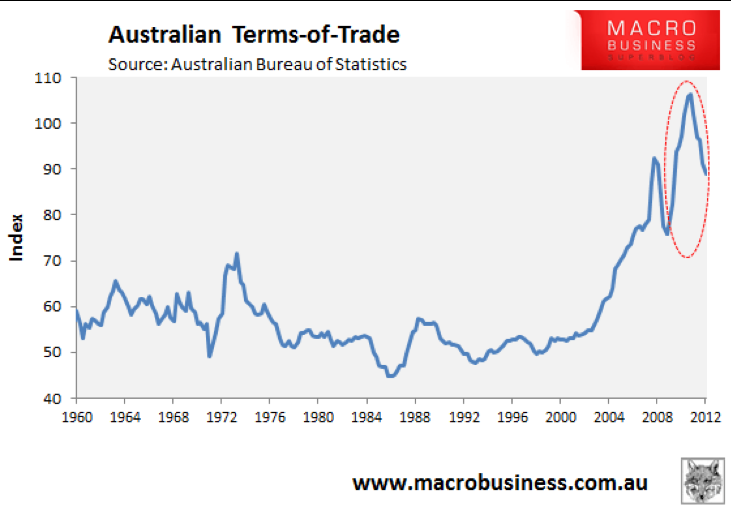
Source: macrobusiness.com.au
5% GDP growth next year, and the year after?
Sorry.
I don’t buy it.
Neither should you.
And since all of Wayne’s latest revenue estimates, and spending estimates, and budget deficit/surplus estimates, are based on that critical GDP growth ass-umption, I think it only fair to say that we can write off this entire budget as a(nother) very, very bad joke.
Problem is, the joke’s on all of us.
UPDATE:
A number of my Twitter followers have kindly informed me that I have made an error. Apparently, the RBA chart for GDP that I’ve referred to above is “Real” (ie, inflation adjusted) GDP, and the budget forecast I’ve referred to is “nominal” GDP.
No matter.
Given the falling Terms of Trade, the closing of that “huge” mining investment pipeline, and a likely incoming Coalition government purportedly looking to slash spending and public service jobs, I reckon even a forecast 2.75 (2013-14) and 3% (2014-15) “Real” GDP is highly unlikely:
UPDATE 2:
Thanks to Twitter follower @gregfranksimmo (EDIT: who got it from Greg Jericho, aka @GrogsGamut), the following chart of both “nominal” and “real” GDP clearly shows that nominal GDP has been declining since December 2010, and has actually been below “real” GDP for the past two quarters, while “real” GDP growth is presently barely managing 3% … despite all those wonderful (and temporary) economic “strengths” Wayne has been boasting about –
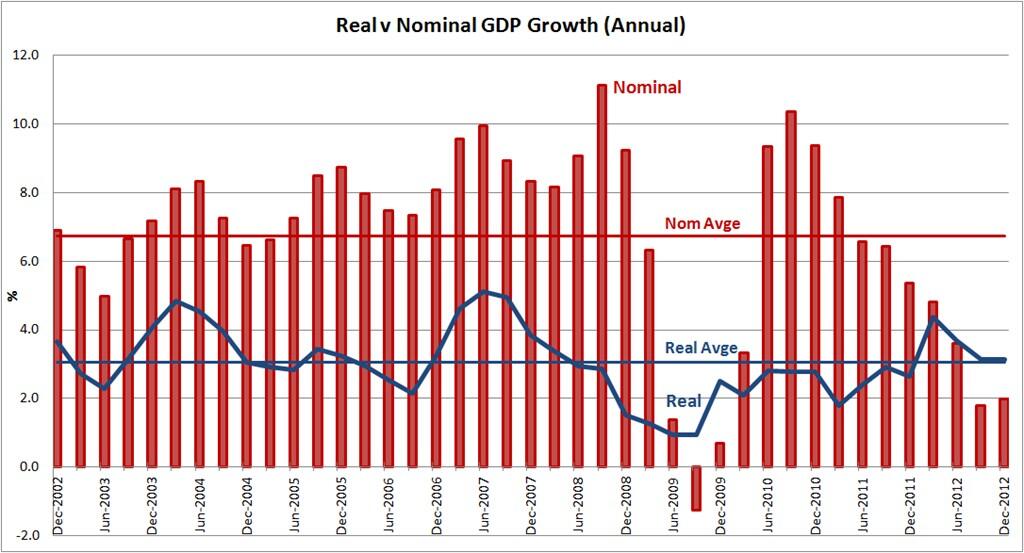
UPDATE 3:
Business Spectator and unabashed ALP apologist Stephen Koukoulas – he of the recent 8 – 12% house price rise prediction – tells us why the nominal GDP forecast is so important for the budget figures:
The forecasts that matter more for revenue, nominal GDP growth, are similarly understated at 3.25 per cent and 5 per cent growth respectively.
Er…
“Nominal” GDP in the Sep ’12 and Dec ’12 quarters was running below “Real” GDP, at less than 2% per annum.
5% “nominal” GDP in each of the next two years?
Chances of that are, I reckon, somewhere roughly between Buckley’s and none.
Meaning, the government’s revenue forecasts have roughly the same chances of coming to pass.
No, I won’t be watching it. The Treasurer’s Budget speech, that is.
Firstly, because I’m sick as a dog, and find it hard to stomach listening to Wayne speak even when at my best.
Secondly, because I already know what’s in it.
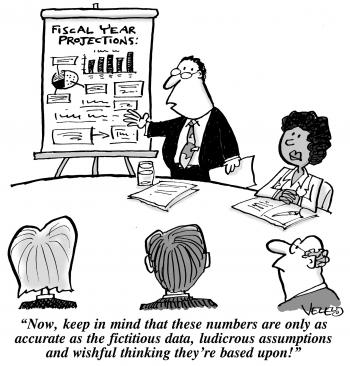
So without further ado, here is my very brief non-viewers guide to tonight’s Budget speech:
cas·u·ist·ry [kazh-oo-uh-stree]
noun, plural cas·u·ist·ries.
1. specious, deceptive, or oversubtle reasoning, especially in questions of morality; fallacious or dishonest application of general principles; sophistry.
That’s all there is to it.
Wayne’s budget speech … in a word.
The RBA’s surprise decision to cut the official interest rate earlier this month has re-energised the housing-debt-spruiker community, who have begun forecasting house price rises of 8 – 12% per annum on the back of more interest rate cuts to come (they presume):

Stephen Koukoulas – economist and ALP apologist
Close examination of just one chart — one drawn directly from RBA statistics — is enough to debunk those who still cling to the belief that the RBA’s cutting interest rates must inevitably result in rising house prices:
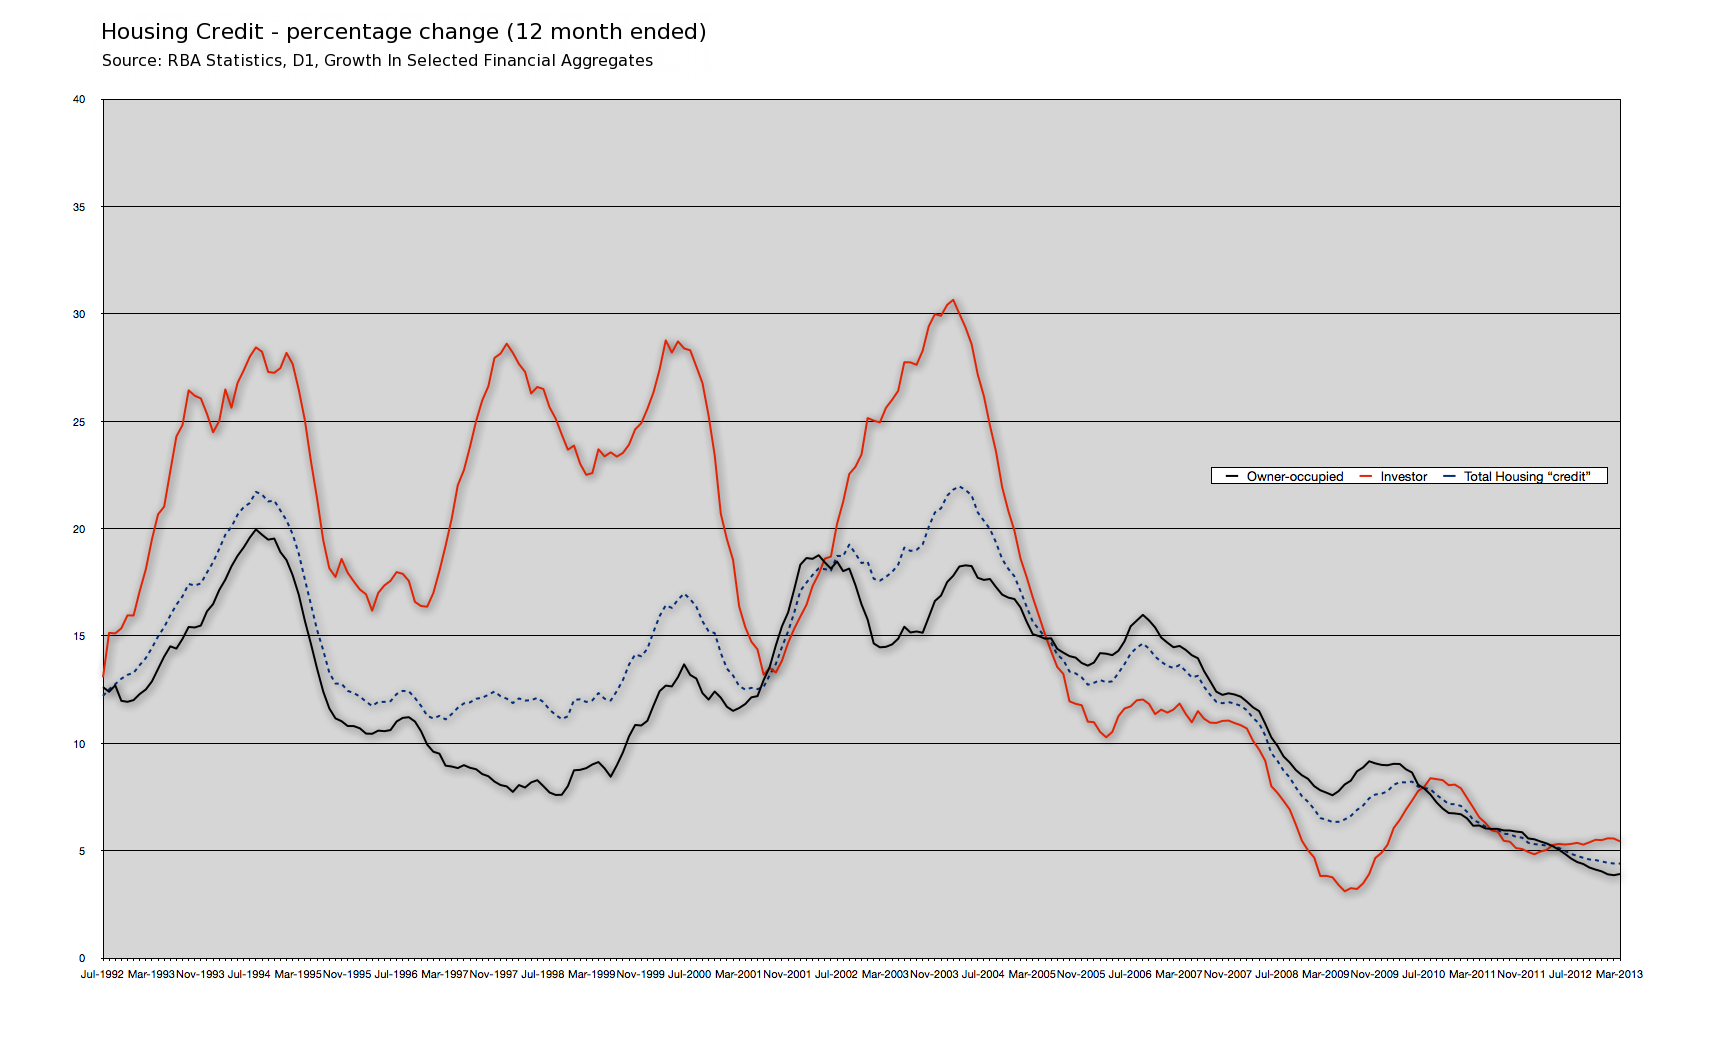
Click to enlarge
This chart shows the all-important annual growth rate in credit for “Owner-occupied” and “Investor” housing, for the period July 1992 to March 2013. As we saw in January’s very popular “The Easy Way To Know Where House Prices Will Go”, anyone can visit the RBA’s website and use their monthly updated Chart Pack to see the true reason why house prices rose so strongly for over twenty years. It was all about the annual growth rate in “credit” for Housing, which is presently five (5) times lower than the peak seen in February 2004.
In that January article, we used the RBA’s own data to discover that the twenty year boom in house prices was largely due to a stunning annual growth rate in so-called “Investor” housing credit…
Clearly then, house prices in Australia were not driven up over the past 15-20 years by “demand” from “population growth”, from people who needed somewhere to live (Owner-occupiers). On the contrary, by far the strongest rates of growth have – during the bubble phase – been driven by so-called “investors”.
… and that is where a closer examination of that one chart above demonstrates that the RBA’s house price policy — trying to pump up the housing bubble again, now that their recently preferred “make room for the mining boom” policy has proven to be seriously short-sighted — is doomed to failure.
Why?
Because using interest rates to influence demand for housing “credit” — especially with “Investors” — has lost its effectiveness. And we can see this clearly, simply by zooming in on the above chart to look at the period November 2007 through to March 2013…
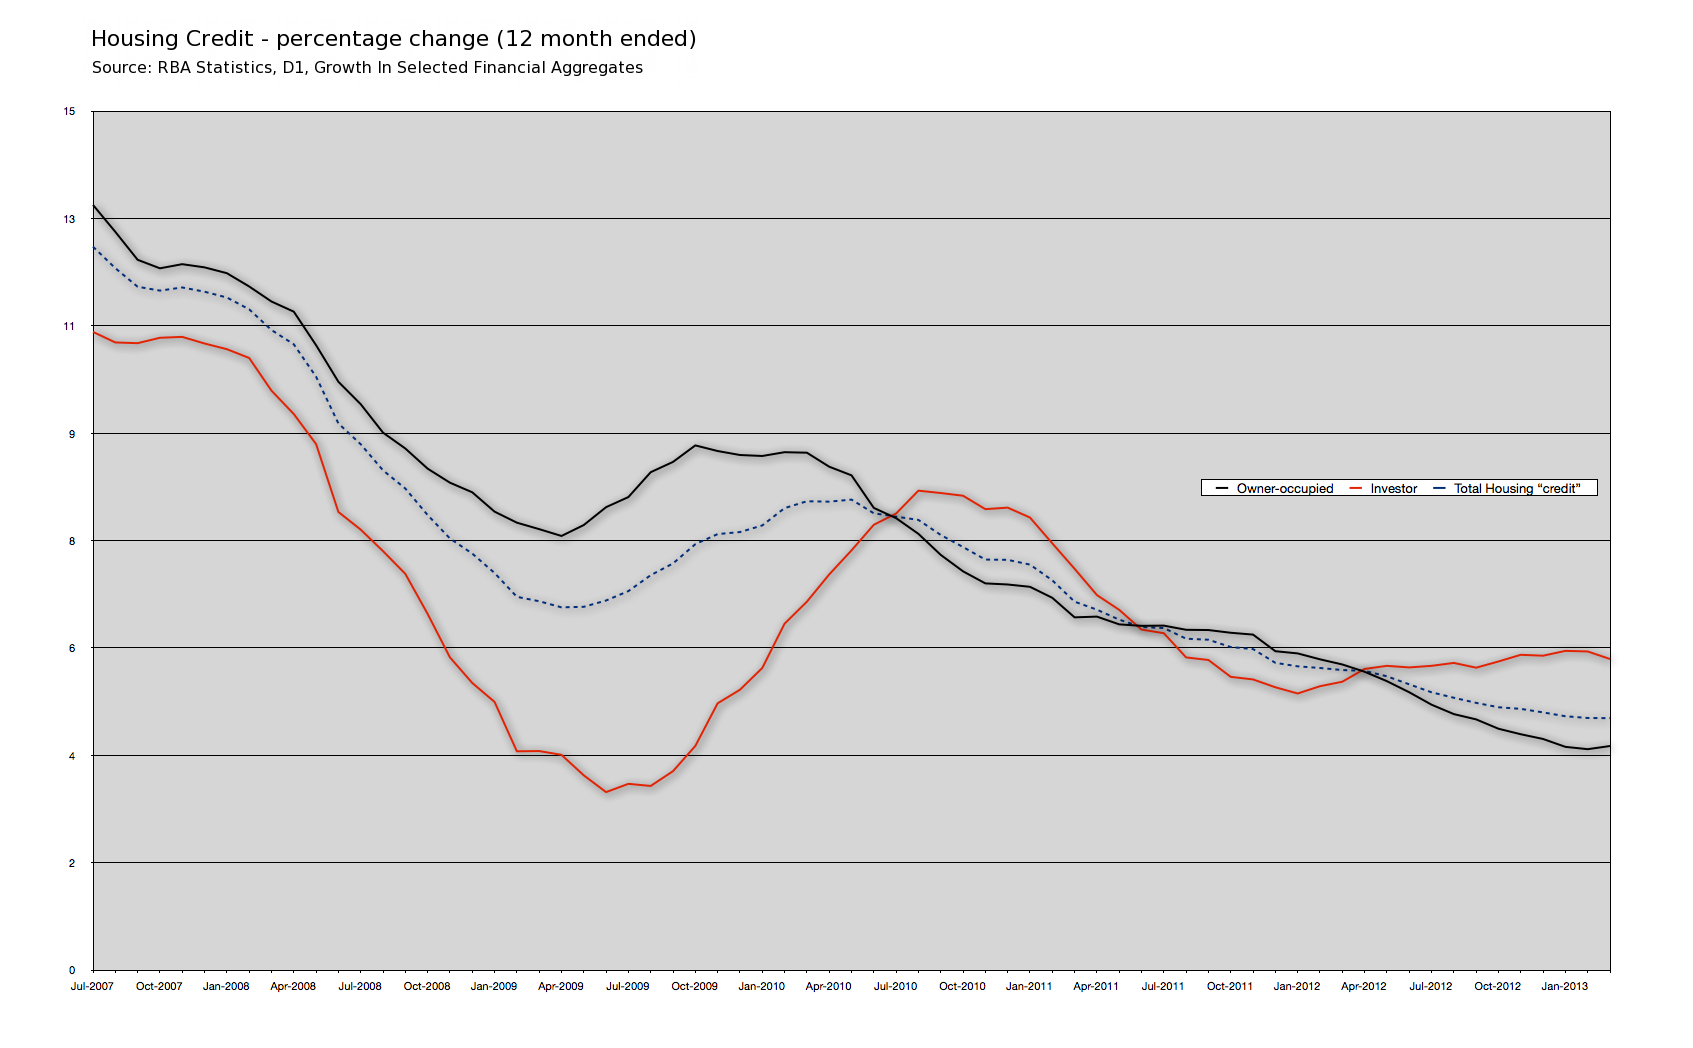
Click to enlarge
… and then adding in the actual interest rate rises, and cuts, and rises, and cuts during this period immediately before and since the GFC:
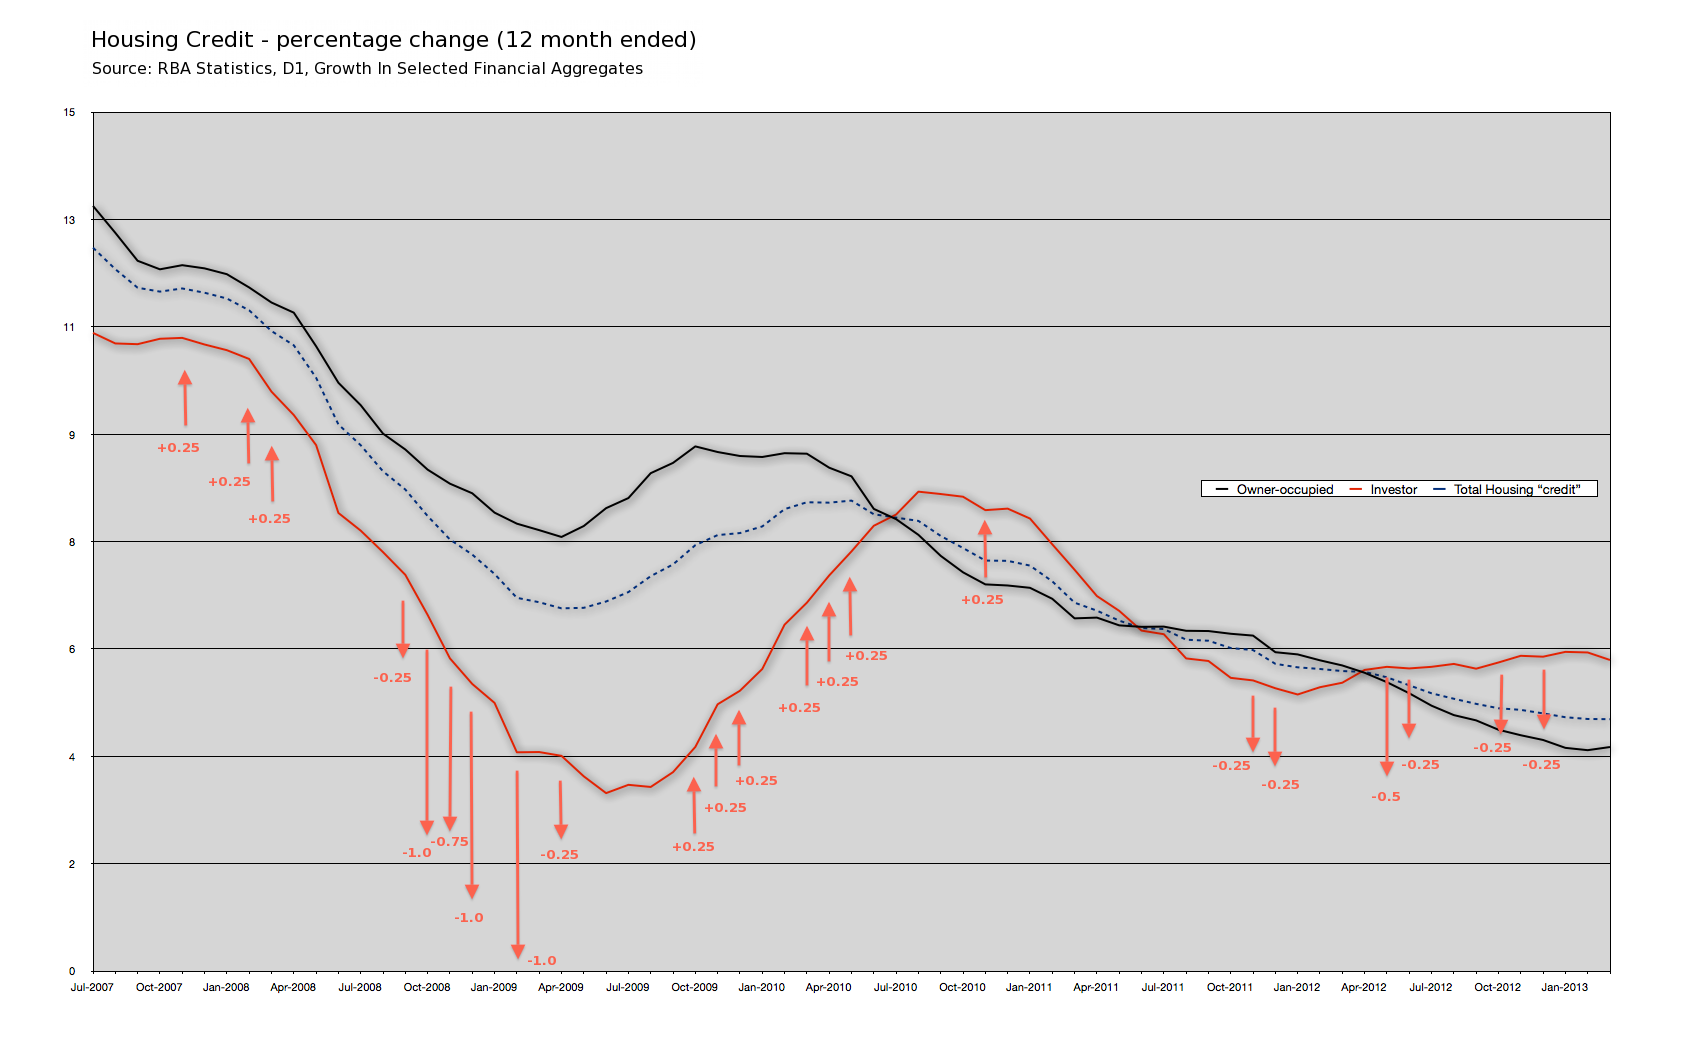
Take careful note of the change in the growth rate of housing “credit” for “Investors”, as compared to “Owner-occupiers”, as interest rates moved.
As you can see, the three (3) interest rate increases in late 2007 through early 2008 tipped both “Investor” and “Owner-occupied” housing credit growth over the cliff. By October 2008, when the RBA began taking a chainsaw to interest rates, housing credit growth was practically in free fall, plummeting from 12% per annum (Total) to 6.3% per annum, before the total 4.25% in “emergency” interest rate cuts halted the decline.
Interestingly, you can see that both the rate of fall and the total decline in housing credit growth was greater for Investors than for Owner-occupiers. As we saw in our January article, this is also what happened in the brief early 2000’s recession:
The rate of growth in “credit” for housing “Investors” was, until early 2004, far in excess of that for “Owner-occupiers”, with the notable exception of the early 2000′s global recession that only briefly affected Australia. At that time, “credit” growth for “Investor” housing plummeted to the same level as the “Owner-occupier” rate, before recovering spectacularly to reach a whopping 30.7% annual growth in Feb 2004.
What prompted the recovery? John Howard’s introduction of the First Home Owners Grant in 2000, and in particular, his doubling it in early 2001. With a rush of newly-enslaved borrowers bidding up house prices, “investors” too rushed back into the welcoming arms of the bankers, as ever only too eager to lend “credit” at interest to willing borrowers against the “security” of “their” house.
We see a similar, though far smaller effect largely repeated in the post-GFC period. The Rudd Government further doubled the First Home Owners Grant. A modest influx of new “First Home Owner” buyers rushing out with their government-debt-financed mortgage deposit to bid for a house, drew the “investors” back into the market as well. By July 2010 the “Investor” housing credit annual growth rate once again overtook that of “Owner-occupied” housing.
But not for long.
As you can see from the chart, the annual growth rate in credit for “Investor” housing had already peaked in August 2010, and had begun to fall, 2-3 months before the RBA’s final 0.25% interest rate increase in November 2010.
“Owner-occupied” housing credit growth, by contrast, had peaked back in October 2009 — the very same month in which the RBA first began to raise interest rates again, from their GFC “emergency low”. The First Home Owners Grant helped keep “Owner-occupied” housing credit growth relatively steady through to March 2010, when it resumed its long, steady post-2004 and pre-GFC decline. It has only now begun to flatline, in the first quarter of 2013.
The important observation to make about this chart, is that since the GFC “peak fear” in late 2008 and early 2009, things have changed. The world has gone past a point of no return, and the old “rules” of monetary and economic policy do not necessarily apply anymore.
While RBA interest rate increases still have the effect of reducing annual growth rates in housing credit, cutting interest rates no longer appears to have much effect in boosting housing credit growth back up again. Since November 2011, the RBA has cut interest rates seven (7) times — the most recent (May) not shown on this chart — to what are now lower than “emergency lows”, without causing an overall increase in the housing credit annual growth rate. Indeed, the RBA’s own Housing Credit growth chart in its Chart Pack confirms this:
The RBA now has the official interest rate at 2.75%. They have cut a full 1.5% since November 2011, without managing to “stimulate” a “recovery” in the growth rate of house prices housing debt.
There are many more knowledgeable observers than I who have argued that 2% is as low as the Australian official interest rate can go; that 2% is effectively ZIRP (Zero Interest Rate Policy) for us. The reason given sounds plausible enough; the Australian economy is essentially financed by borrowing “capital” from abroad, so with the rest of the West operating on ZIRP, we need a +2% interest rate difference in order to have any hope of continuing to attract foreign “capital”.
If the RBA is indeed “lower bound” by the 2% level, then the above chart makes one thing pretty clear.
At the present 2.75% cash rate, even another 0.75% in possible interest rate cuts is unlikely to “stimulate” much if any additional growth in Housing credit.
And with annual housing credit growth now running five (5) times lower than the February 2004 peak, and barely two-thirds the level when interest rates hit the 3% “emergency low” in April 2009, the RBA’s policy of trying to re-stimulate the housing bubble to support the economy after the mining boom … is doomed.
Simply, the RBA is pushing on a string:
This is the crux of the “pushing on a string” metaphor – that money cannot be pushed from the central bank to borrowers if they do not wish to borrow.
Don’t Buy Now.


Comments